QQ Plot
Quantile–Quantile (Q–Q) plots compare sample quantiles to theoretical quantiles of a reference distribution to assess distributional agreement.
Features
Visual check against a chosen reference distribution (default: Normal)
Optional confidence envelope for point-wise uncertainty
Best-fit regression line with R² annotation
Publication-ready styling and custom scatter kwargs
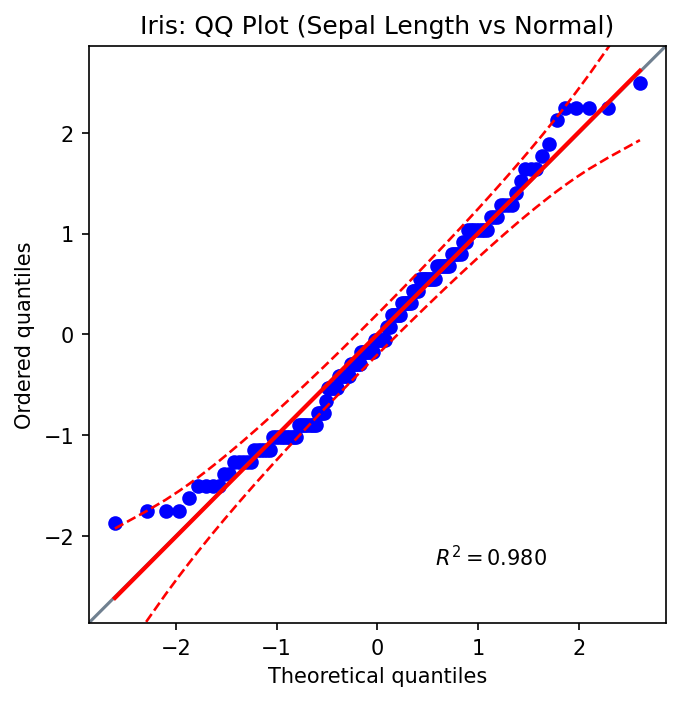
Basic Usage (Iris)
from ggpubpy import qqplot, load_iris
import matplotlib.pyplot as plt

iris = load_iris()
fig, ax = plt.subplots(figsize=(5, 5))
qqplot(iris["sepal_length"].values, dist="norm", confidence=0.95, ax=ax)
ax.set_title("Iris: QQ Plot (Sepal Length vs Normal)")
plt.tight_layout()
Second Example (Iris)
from ggpubpy import qqplot, load_iris
import matplotlib.pyplot as plt

iris = load_iris()
fig, ax = plt.subplots(figsize=(5, 5))
qqplot(iris["petal_width"].values, dist="norm", confidence=0.95, ax=ax)
ax.set_title("Iris: QQ Plot (Petal Width vs Normal)")
plt.tight_layout()
Function Parameters
qqplot()
x(array-like): Sample datadist(str or scipy.stats distribution): Reference distribution (default: “norm”)sparams(tuple, optional): Distribution shape/location/scale parametersconfidence(float or bool): Envelope level in (0,1) or False to disable (default: 0.95)square(bool): Keep equal aspect ratio (default: True)ax(matplotlib.axes.Axes, optional): Target axes**kwargs: Passed toAxes.scatter(e.g., color, marker, alpha)
Tips
Use the envelope to gauge departure from the reference distribution.
Provide
sparamsfor non-standard distribution parameters.Keep axes square for visual parity of deviations.
Style points via
**kwargsfor clarity (e.g.,alpha=0.7).
Integration
from ggpubpy import qqplot, plot_boxplot_with_stats, load_iris
import matplotlib.pyplot as plt

iris = load_iris()
fig1, ax1 = plt.subplots(figsize=(5, 5))
qqplot(iris["sepal_length"].values, ax=ax1)

fig2, ax2 = plot_boxplot_with_stats(iris, x="species", y="sepal_length")
Note: The figures on this page are generated by running examples/qqplot_example.py and examples/plots_manipulation_examples.py.