Bland–Altman Plot
Bland–Altman plots visualize agreement between two measurement methods by showing mean bias and limits of agreement.
Features
Mean difference (bias) line and ±k·SD limits of agreement (default k=1.96)
Optional confidence intervals for bias and agreement limits
Optional textual annotations of key values
Publication-ready styling and custom scatter kwargs
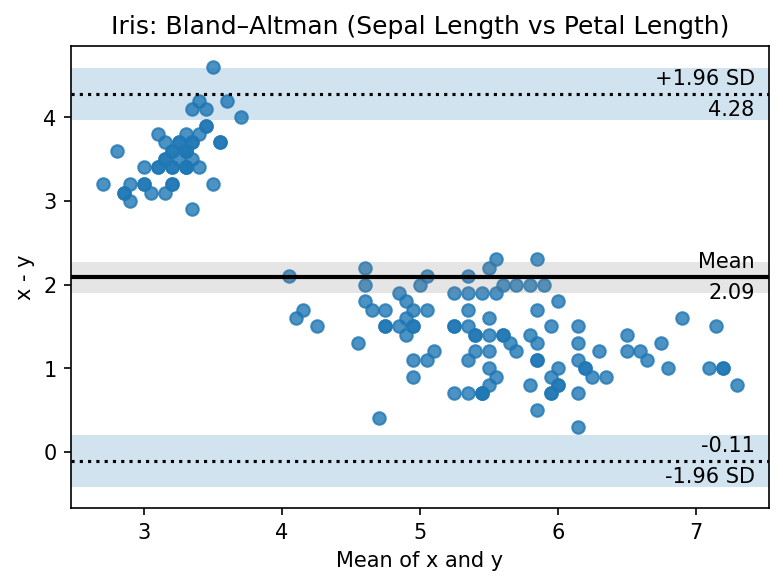
Basic Usage (Iris)
from ggpubpy import plot_blandaltman, load_iris
import matplotlib.pyplot as plt

iris = load_iris()
fig, ax = plt.subplots(figsize=(6, 4))
plot_blandaltman(
    iris["sepal_length"].values,
    iris["petal_length"].values,
    agreement=1.96,
    confidence=0.95,
    annotate=True,
    ax=ax,
)
ax.set_title("Iris: Bland–Altman (Sepal Length vs Petal Length)")
plt.tight_layout()
Second Example (Iris)
from ggpubpy import plot_blandaltman, load_iris
import matplotlib.pyplot as plt

iris = load_iris()
fig, ax = plt.subplots(figsize=(6, 4))
plot_blandaltman(
    iris["sepal_width"].values,
    iris["petal_width"].values,
    agreement=1.96,
    confidence=0.95,
    annotate=False,
    ax=ax,
)
ax.set_title("Iris: Bland–Altman (Sepal Width vs Petal Width)")
plt.tight_layout()

Function Parameters
plot_blandaltman()
x, y(array-like): Two sets of measurements (equal length)agreement(float): Multiplier for limits of agreement (default: 1.96)xaxis(str): Reference for x-axis: “mean”, “x”, or “y” (default: “mean”)confidence(float or None): CI for bias and LoA; None disables shaded CIsannotate(bool): Add text annotations (default: True)ax(matplotlib.axes.Axes, optional): Target axes**kwargs: Passed toAxes.scatter(e.g., color, alpha)
Tips
Use
xaxis="mean"for the standard Bland–Altman representation.Consider setting
annotate=Falsefor dense datasets.Adjust
agreementto explore different LoA (e.g., 2.0 for exact ±2 SD).Ensure comparable units and consistent preprocessing for meaningful comparisons.
Note: The figures on this page are generated by running examples/bland_altman_example.py and examples/plots_manipulation_examples.py.